
For over 35 years, researchers and advocacy groups have warned about the shortage of special education faculty staffing U.S. institutions of higher education (e.g., deBettencourt et al., 2016; Sindelar et al., 1993; Sindelar & Taylor, 1988). Special education faculty members conduct critical work across varied tasks and roles: they prepare future and in-service teachers, keep up with recent events and findings of the field (e.g., evidence-based practices; Cook & Cook, 2013), conduct research that advances knowledge for improving outcomes for students with disabilities, and mobilize knowledge for use in K–12 classrooms. Unfortunately, a shortage of special education faculty contributes to the ongoing shortage of special education K–12 teachers (HECSE, 2023a) and weakens the field’s capacity for contributing impactful research, which, in turn, has consequences for children with disabilities and their families.
Although the field has long acknowledged and continues to report a low supply of special education doctoral students to fill faculty positions (i.e., data demonstrating declines in the number of special education doctoral programs; HECSE, 2023a; National Center for Science and Engineering Statistics [NCSES], 2019) the last profile on the demand for special education faculty using faculty advertisements relied on 2010 data (Montrosse & Young, 2012). In the following sections, we (a) provide a chronological overview of past profiles of the shortage of special education faculty and highlight implications for the field, (b) discuss the outlook of special education faculty supply and demand following the last large funded project investigating the shortage, and (c) describe the rationale and research questions of the present study that seeks to provide an updated picture of the demand for special education faculty leveraging faculty advertisement data and open science practices.
Profiles of the Demand for Special Education Faculty: A Chronological Overview
Previous studies have explored faculty advertisements as a measure of the demand for special education faculty, starting before The Chronicle of Higher Education job advertisements appeared on the Internet (e.g., Sindelar & Taylor, 1988). For example, Sindelar et al. (1993) used The Chronicle of Higher Education advertisements from 1988 to identify failed searches of institutes of higher education (IHE), with findings that suggested demand for special education faculty was outstripping supply. Years later, Ryndak et al. (1999) searched The Chronicle of Higher Education advertisements from 1994–1996 for assistant professor special education positions in particular. They collected a total of 195 assistant professor advertisements for the 1994–1995 academic year and 202 advertisements for the 1995–1996 academic year. They coded each advertisement for descriptors of expertise in certain disability categories, and the most prevalent was a focus on the learning disability category. Moreover, the researchers found that most IHEs were advertising across multiple needed areas of expertise in special education (e.g., learning disabilities, emotional disturbance), and they reasoned that IHEs were perhaps casting a wide net because of the “well-documented shortage” of special educators across the country (Ryndak et al., 1999, p. 38). These early studies spurred growing concerns about the shortage of special education faculty and caught the attention of the U.S. Department of Education’s Office of Special Education Programs (OSEP).
The 2001 Faculty Shortage Study
In 1999, OSEP funded a large research project to investigate the U.S. supply of and demand for new doctoral graduates in special education. This project became known as The Faculty Shortage Study. Key findings of the study included (a) the number of special education doctorates produced annually decreased by 30% from 1981–2001, (b) over one-third of special education faculty positions across the nation remained unfilled, and (c) a shortage of special education faculty was associated with a shortage of special education teachers and service providers (Smith et al., 2011). Overall, the study provided evidence of an imbalance between the supply of special education doctorates and the demand for special education faculty.
The Faculty Shortage Study had a wide-reaching impact. The findings influenced policy, were referenced in House and Senate Committee Reports, have been cited extensively in publications and OSEP Leadership Preparation applications, and influenced an increase in grant funding to support doctoral student training (Smith et al., 2011). Furthermore, the study findings were disseminated in a 2003 special issue of the journal Teacher Education and Special Education. In one of the other articles in the same special issue, Sindelar and Rosenberg (2003) conducted advertisement searches in The Chronicle of Higher Education from 1997–1998 to assess the demand for special education faculty. The researchers identified 240 faculty advertisements, with assistant professor being the most common (n = 96). They also surveyed search committee chairs to inquire about successful and failed faculty searches. Sindelar and Rosenberg (2003) concluded that “these data indicated clearly that demand for special education faculty is substantial and suggest that worsening shortages in the supply of qualified candidates may undermine our capacity to produce a highly qualified workforce and ultimately diminish the quality of education programs for children and youth with disabilities” (p. 170). Thanks to The Faculty Shortage Study, the field now had a clearer understanding of the supply and demand for special education faculty but was still lacking clarity about how to increase the supply of effective leaders.
The 2007–2011 Special Education Faculty Needs Assessment (SEFNA) Project
OSEP funded the SEFNA Project in 2007, a four-year comprehensive project to assess the nation’s potential to (a) produce a sufficient supply of new doctoral graduates to meet the demand for special education faculty and (b) investigate whether the demand for new faculty had changed since the 2001 OSEP-funded Faculty Shortage Study. The SEFNA final report was published in 2011, 10 years following The Faculty Shortage Study. The report communicated findings and implications regarding investigations of both faculty supply and demand (Smith et al., 2011).
Regarding factors impacting special education faculty supply, the project explored characteristics of U.S. special education doctoral programs and their funding levels. Researchers identified a total of 97 U.S. special education doctoral programs in the year 2008. The most common doctoral program concentrations were general special education, such as mild/moderate and/or cross-categorical disabilities, learning disabilities, emotional or behavioral disabilities, and early childhood/early intervention (Smith & Montrosse, 2012). The SEFNA project also explored how leadership grants contribute to the supply of special education doctoral students, motivated by the 2001 study recommendation to increase appropriations and allocations for the funding of doctoral-level leadership grants. Their analysis of leadership grants and funding levels indicated that OSEP was the primary source of funding for special education doctoral training. In 2009, OSEP funded 85 special education leadership preparation projects across the United States, which represented a considerable increase from the 30 projects funded in fiscal years 2000 and 2001 (Smith et al., 2011). To best support the quality of education for students with disabilities and their families, researchers urged that “the federal government must continue and expand on its investment in the leadership program funded through OSEP” (West & Hardman, 2012, p. 159).
SEFNA analysis of special education faculty demand again relied on faculty advertisement data. Montrosse and Young (2012) identified 114 special education faculty advertisements posted in The Chronicle of Higher Education from June 2010–November 2010, with 49% of the total advertisements for the assistant level (a total of 73% of the advertisements were for either assistant professor or assistant/associate professor positions). Further analysis of a sample (n = 43) of the total pool of 114 advertisements revealed that the most frequent specialization area of the sample was general special education (mild/moderate or generic); the next most common specializations were learning disabilities (24%), early childhood (21%), and autism spectrum disorder (18%). Combining data about the special education faculty job market from multiple sources (e.g., surveys of search committee chairs) and across years, the study concluded that “there have consistently been more advertised positions than there are numbers of graduates wanting to secure them” (Montrosse & Young, 2012, p. 146) and thus confirmed the continuation of the supply/demand imbalance in special education. One overall conclusion of the SEFNA project was that despite improved production rates of new doctorates with special education expertise, the nation was nevertheless facing an “unprecedented shortage of special education faculty” (Smith, 2012, p. 99). Moreover, other SEFNA findings predicting future faculty shortage and its causes (e.g., faculty member retirements) projected a substantial percentage of students with disabilities being underserved (Smith et al., 2011).
The two large OSEP-funded studies (i.e., The Faculty Shortage Study and the SEFNA project) provided detailed pictures of the special education faculty shortage. Importantly, the findings pointed to key recommendations for abating the shortage, including an increase of funding to award more doctoral preparation leadership projects (Smith et al., 2011; West & Hardman, 2012). These two studies were highly influential on the field. Yet, surprisingly, these studies and their publications reporting on data over 10 years old continue to be the main citations (with the main exception being the Earned Doctorates Survey data [NCES, 2019] focused on supply) for the longstanding shortage of special education faculty (e.g., deBettencourt et al., 2016; Schles & Robertson, 2019). That is, the most up-to-date profile of the supply/demand imbalance continues to be the SEFNA report published over a decade ago.
Outlook of the Special Education Supply and Demand Since the SEFNA Project
While the SEFNA study conducted by Montrosse and Young (2012) appears to be the last investigation of advertisements detailing the demand for special education faculty, the field continues to acknowledge a supply/demand imbalance and has disseminated thoughtful recommendations to mitigate its consequences (e.g., deBettencourt et al., 2016). One source for updates is the Higher Education Consortium for Special Education (HECSE), a national organization consisting of IHEs that grant doctoral degrees in special education or have a special education emphasis as part of a larger related doctoral degree program. HECSE disseminates multiple resources that highlight updates regarding the shortage of special education faculty and are available on their website, including “The Shortage of Special Education Teachers and Higher Education Faculty” fact sheet (HECSE, 2023a).
The HECSE January 2023 fact sheet, which highlights findings from the NCSES-sponsored Survey of Earned Doctorates (i.e., an annual census of individuals who earn research doctoral degrees from accredited U.S. academic institutions), reported three alarming trends: (a) a 19% reduction between 2009 and 2018 in the number of special education doctoral programs; (b) a total of 79 special education doctoral programs in 2018, the lowest number of special education doctoral programs in decades; and (c) a 17% reduction between 2017 and 2021 in the number of doctoral graduates available to fill special education faculty positions (HECSE, 2023a; NCSES, 2019). Another 2023 resource, the HECSE 2023 Legislative Priorities document, highlighted the need for investing in special education personnel, recommending $300 million for Personnel Preparation under IDEA for 2024 fiscal year appropriations (HECSE, 2023b). While the HECSE fact sheet, HECSE Legislative Priorities, and the Survey of Earned Doctorates (NCSES, 2019) provide valuable updated information and data regarding the supply of new doctorates available to fill special education positions, the resources do not offer insights on the current demand for special education faculty.
The Present Study
The present study and its focus on collecting and analyzing job advertisements to provide insights on the current demand for special education faculty started as an outreach effort. Next, we share the outreach goal that motivated the project, how our outreach and research aims were supported by a paired open database, and the rationale and research questions of the present study.
Outreach Goal
The present study’s focus on tracking U.S. special education faculty advertisements started as an outreach effort in 2021. We were inspired by a trend on social media in other fields: Scholars on Twitter were tweeting faculty advertisements as an effort to share new openings with scholars on the job market. These posts supported job-seeking scholars because finding advertisements can be an arduous task that requires searches across multiple websites (e.g., The Chronicle of Higher Education, Inside Higher Education Jobs). Navigating the academic job market is well-acknowledged as a stressful endeavor across disciplines (e.g., Fernandes et al., 2020; Hsu et al., 2021; McDowell et al., 2014), and these outreach efforts appeared to be gaining traction. However, the trend had not yet been introduced in the field of special education.
Motivated by a desire to support fellow special education scholars, we started an open-access spreadsheet in 2021 to which we added new special education faculty advertisements. We periodically shared the spreadsheet link via a personal faculty Twitter account. The spreadsheet was accessed more than 1,600 times within the data collection timeframe, suggesting that scholars across the nation were using the list to support their job search. We communicated an overview of the collected 2021–2022 advertisements in a newsletter article (Rodrigues & Mirielli, 2022), which we considered a preliminary study because the data were not yet collected in a systematic way for research—it was instead collected for outreach.
Due to the interest in the special education faculty advertisement data, we determined that the next iteration of the project could serve dual purposes: outreach and research. We thus planned a robust preregistered study for collecting and analyzing U.S. special education faculty advertisements posted in 2022–2023 that also allowed us to continue supporting fellow scholars.
Special Education Faculty Jobs Paired Open Database (POD)
To combine outreach and research goals, we leveraged an innovative type of open data that we call a paired open data(base), or POD. Open data means providing open access to raw data following the completion of a study, with the purpose of enabling other researchers to verify results reported in a study and to conduct analyses investigating novel hypotheses (Cook et al., 2023). A POD not only provides raw data but also simultaneously serves another non-research-based purpose. The two paired purposes of the Special Education Faculty Jobs POD were the following: (a) data are openly accessible following study completion to support the typical goals of open data (e.g., research use) and (b) data were accessible during the data collection timeframe to serve as outreach to scholars on the job market.
Rationale and Research Questions of the Present Study
The present study seeks to provide a profile of the demand for U.S. special education faculty by investigating faculty advertisements posted from 2022–2023 and collected in the Special Education Faculty Jobs POD. Importantly, this work aims to serve as an update to the last study that used special education faculty advertisement data from 2010 (Montrosse & Young, 2012). As stated by deBettencourt et al. (2016), “the need for leadership personnel prepared at the doctoral level to fill special education faculty positions at IHEs and have the skill sets necessary to train the next generation of pre-K–12 teachers is at a critical point in time” (p. 130), and the present study has the potential to identify specific areas of expertise IHEs are seeking in special education faculty. Furthermore, the current study allows the opportunity to compare numbers of open positions in 2022–2023 to those of prior years (Montrosse & Young, 2012; Ryndak et al., 1999; Sindelar & Rosenberg, 2003). Important to acknowledge is that other factors also impact faculty demand (e.g., anticipated faculty retirements); yet we use the term “demand” in the current study based on prior literature. That is, faculty advertisement data have consistently been leveraged as the primary measure of special education faculty demand (e.g., Montrosse & Young, 2012) since the seminal work and methodology established by Sindelar and Taylor (1988). Overall, we view this current study as a critical first step that can contribute to and inform future work seeking to update a broad picture of the supply/demand of special education faculty that holds critical implications for children with disabilities.
The study is guided by two research questions to explore the demand for U.S. special education faculty in the 2022–2023 job market. First, what are the identifiable patterns in each coding category (i.e., specialization, institution Carnegie Classification, position type, location, tenure status, posting date, required application materials) for U.S. special education faculty advertisements during the 2022–2023 job market cycle? Second, what are the identifiable relationships among coding categories (e.g., tenure status by Carnegie Classification)? As reflected in our preregistration, for research question 1 we anticipated the majority of job advertisements would be for assistant professor positions and tenure track positions. Research question 2 was exploratory; therefore, we did not have any specific hypotheses regarding relationships among coding categories. For reporting on research question 2 in the present manuscript, we focus on relationships between the institution Carnegie Classification and the other coding categories, as Carnegie Classification is often used as a means for grouping and studying similar institutions (The Carnegie Classification of Institutions of Higher Education [CCIHE], n.d.). All other cross-tabulations among coding categories are provided as a supplemental material attached to our preregistration. Our preregistration is available at osf.io/uhnxp.
Method
Job Advertisement Searches
We reviewed job advertisements for special education faculty positions in the United States posted between August 1, 2022, and March 1, 2023. This data collection period was selected because job advertisements for faculty positions are often posted one year prior to the position start date (i.e., positions with a start date of August 2023 may be posted in August 2022). Searches were conducted on four websites: HigherEdJobs, Inside Higher Ed Careers, The Chronicle of Higher Education, and Academic Keys using the keyword “Special Education” (Academic Keys, n.d.; Chronicle of Higher Education, n.d.; Inside Higher Ed Careers, n.d.; HigherEdJobs, n.d.). The decision to use these four websites was informed by prior research as well as advice from an expert in the field (D. Smith, personal communication, March 10, 2021; Division for Research – CEC, 2020; Montrosse & Young, 2012). Only job postings for full-time special education faculty positions located in the United States with a start date of Fall 2023 were included in the list. Advertisements for school-level administration positions related to special education, nonfaculty positions, post-doctoral positions and part-time/adjunct positions were excluded.
Searches were conducted weekly. Given the POD has the dual purpose of open data for research and outreach, data were coded directly into the POD weekly during the data collection cycle to ensure all relevant information was available immediately for individuals on the job market. During the initial search on August 1, 2022, all advertisements populated from the search were reviewed (i.e., advertisements posted on or prior to August 1, 2022) and any advertisements fitting all inclusion criteria were included in the study (n = 2). All subsequent searches included advertisements posted after August 1, 2022. Once advertisements that met all inclusion criteria were identified, the original advertisements as posted on the institution’s websites were located and saved as a PDF to ensure all relevant information was captured prior to the positions being filled and the advertisements being removed. PDFs of the individual job advertisements can be found attached to our preregistration.
Paired Open Database Management and Outreach
As previously described, this study leveraged an innovative type of open data called paired open data (POD). All data were housed in the Special Education Faculty Jobs POD, an open access spreadsheet (bit.ly/2022_2023_POD). Additional advertisements sent to the research team—which were not identified by our weekly searches—were included in the POD. These advertisements were marked “personal communication” and included in the POD for outreach purposes but excluded from subsequent analyses. These advertisements were excluded from the study in an effort to be systematic, as they were not captured by the data collection procedures. One possible reason an advertisement may not have been identified through our data collection procedures could be a situation in which an institution posted the advertisement on the institution’s human resources website but did not promote the advertisement via additional outlets (i.e., the job advertisement websites used for data collection in this study); the search committee chair or another faculty member at the institution who was familiar with the POD could then reach out to us via email to request that their open position be included in the POD. If an advertisement was sent via personal communication and later identified through data collection, the advertisement source was changed to “job advertisement website” and included in the study. The link to the POD was disseminated via Twitter from one of the author’s personal Twitter accounts using the hashtag #SpecialEdHigherEdJobs. The POD was also shared widely at research conferences and by word of mouth. The POD was viewed over 2,100 during the data collection time frame, averaging over 300 views per month. Following completion of data collection, the POD was downloaded and saved locally for data cleaning. The data from this study can be found attached to the preregistration and as supplemental material to this manuscript.
Coding Categories
Each job advertisement was coded across seven main categories: specialization, Carnegie Classification, position type, location, tenure status, posting date, and application materials. Coding categories and menus were informed by prior studies of faculty job advertisements in special education and other fields (e.g., Lubisco et al., 2019; Montrosse & Young, 2012; Ryndak et al., 1999), as well as the preliminary data collection conducted during the prior year’s job market cycle (Rodrigues & Mirielli, 2022). Most coding categories required the coder to choose from a menu of force-choice items (e.g., force-choice items for tenure status were: tenure track, opportunity for tenure track, non-tenure track, and not specified). These selections were made based on the language used in the job advertisement (e.g., job advertisement stated “opportunity for tenure track”). One coding category—specialization—did not have a menu; rather, the coder directly copied language about specialization from the advertisement with the plan to code and condense following the completion of the study. The method for determining the specialization subcategories is described next, followed by a description of the Carnegie Classification category that is central to research question 2. A breakdown of the remaining coding categories can be found in the results section.
Specialization
Specialization was copied directly from the job advertisement. Following completion of data collection, each specialization was coded dichotomously as (a) specifying only the broad categorization of “Special Education” or (b) containing additional Special Education areas of focus. To code the job advertisements with additional areas of focus, the authors identified three large specialization categories (i.e., population, grade level, content) as well as smaller codes within each (e.g., learning disability in the category of population). A minimal number of codes were combined to ensure specialization was reported as written in the original job advertisement (e.g., specific learning disability remains a separate code from high incidence despite this disability category typically falling under the umbrella of high incidence disabilities). Next, all 223 job advertisements were coded across all possible specialization categories by two graduate research assistants (GRAs) to ensure inter-rater reliability. Initially, 74% of the total job advertisements were coded with 100% agreement; following initial coding the two coders met and discussed any differences until they coded 100% of the advertisements with 100% agreement.
Carnegie Classification
The Carnegie Classification is a widely used framework for categorizing institutions of higher education within the United States (CCIHE, n.d.). This study used the search feature within the Carnegie Classification website to determine the Basic Classification (i.e., classification given to any degree-granting institution within the United States; CCIHE, n.d.) for each institution providing a job advertisement. The Basic Carnegie Classifications includes doctoral universities, master’s colleges and universities, baccalaureate colleges, baccalaureate/associate’s colleges, associate colleges, and special focus institutions. For this study the Basic Classifications were used, as well as Carnegie Classification subgroups within the doctoral university’s classification (i.e., R1: Doctoral Universities – Very high research activity, R2: Doctoral Universities – High research activity, D/PU: Doctoral/Professional Universities), and master’s college and universities classification (i.e., M1: Master’s Colleges and Universities – Larger programs, M2: Master’s Colleges and Universities – Medium programs, M3: Master’s Colleges and Universities – Small programs). These subgroups were included as advertisements may differ between subgroups within the same Basic Classification.
Inter-Rater Reliability
During the first 10 weeks of data collection, two Graduate Research Assistants (GRAs) in a special education doctoral program independently conducted all data collection and coding procedures and met weekly for comparison to ensure inter-rater reliability (IRR). Initially, across the 10 weeks, the only weeks in which differences occurred between each GRA’s total number of identified job advertisements was by an average difference of plus or minus two advertisements (e.g., one GRA identifying eight advertisements and the other identifying six of those eight); this slight difference occurred five out of the 10 weeks. During comparison, GRAs not only compared the number of job advertisements identified, but also ensured the job advertisements selected for inclusion on the POD matched. For the remaining five weeks, GRAs identified the same number of job advertisements. Each week the GRAs met and discussed any differences until they reached 100% agreement on the inclusion of job advertisements. Across all coding categories within the POD, the GRAs averaged 97% agreement. Following individual coding, the GRAs met and discussed any differences until they coded 100% of the categories with 100% agreement. Disagreements primarily related to the coding of Specialization (e.g., coder 1 recorded the broad category of “special education” while coder 2 recorded an additional area of specialization such as “Specific Learning Disabilities” upon locating it within the description of the job advertisement). Disagreements were addressed through discussion where both coders pointed out the location of the coding category information in the job advertisement. For the remainder of data collection, the two GRAs alternated as data collector weekly to ensure all job advertisements meeting inclusion criteria were located and coded appropriately.
Results
The present study aimed to provide a profile of the demand for U.S. special education faculty through the analysis of job advertisements posted during the 2022–2023 job market cycle. Below we provide results from research question 1 and research question 2.
Research Question 1: Identifiable Patterns Within Each Coding Category
Research question 1 sought to identify patterns within each coding category for the 2022–2023 advertisements. The results are organized by (a) specialization; (b) Carnegie Classification; (c) position type; (d) location; and (e) tenure status, posting date, and application materials.
Specialization
A total of 223 unique job advertisements were collected and analyzed. Of the 223 unique job advertisements, 109 (49%) focused only on the broad specialization of “Special Education” while the other 114 (51%) sought a candidate with expertise in one or more additional special education areas of focus. Of the 114 job advertisements, 77 identified a distinct disability focus or population (e.g., early childhood special education, autism spectrum disorder, English learners), and 52 identified a distinct content focus (e.g., reading, applied behavior analysis [ABA], transition). A total of eight job advertisements identified a large list of possible special education areas of focus, five included additional specializations outside the area of special education (e.g., data-/cyber-connected disciplines), four were hiring for involvement in established research labs or projects, and eight included additional responsibilities or positions (e.g., coordinator for field, director of programs). It is important to note that these categories are not mutually exclusive, meaning that some advertisements may have included an area of focus population and content area, as well as included additional responsibilities. Across all job advertisements, the most commonly reported special education population area of focus was high incidence disabilities (n = 18, 8%), and the most commonly reported special education content area of focus was reading/literacy (n = 15, 7%). Table 1 provides the frequencies and percentages of each additional special education area of focus.
Table 1: Job Advertisement Specialization Categories.
| SPECIALIZATION CATEGORY | n | % |
| Broad Specialization of “Special Education” | 109 | 48.9 |
| Additional Special Education Areas of Focus: Population | ||
| High Incidence | 18 | 8.1 |
| Early Childhood Special Education | 14 | 6.3 |
| Low Incidence | 9 | 4.0 |
| Autism Spectrum Disorder | 8 | 3.6 |
| Specific Learning Disability | 7 | 3.1 |
| Emotional Behavioral Disorders | 6 | 2.7 |
| English Learners | 5 | 2.2 |
| Visual Disability | 5 | 2.2 |
| Deaf Education | 3 | 1.3 |
| Cross Categorical | 2 | 0.9 |
| Dyslexia | 2 | 0.9 |
| Intellectual Disability | 2 | 0.9 |
| Sensory Disability | 2 | 0.9 |
| Other (i.e., Juvenile Justice) | 4 | 1.8 |
| Additional Special Education Areas of Focus: Grade Level | ||
| Middle | 4 | 1.8 |
| Elementary | 3 | 1.3 |
| K–12 | 3 | 1.3 |
| Teacher Education | 2 | 0.9 |
| Secondary | 1 | 0.4 |
| Additional Special Education Areas of Focus: Content | ||
| Reading/Literacy | 15 | 6.7 |
| Applied Behavior Analysis | 10 | 4.5 |
| Academics | 8 | 3.6 |
| Inclusion | 8 | 3.6 |
| Technology | 6 | 2.7 |
| Behavior | 4 | 1.8 |
| Evidence Based Practices | 4 | 1.8 |
| Implementation Science | 3 | 1.3 |
| Positive Behavior Interventions and Supports | 3 | 1.3 |
| Policy | 3 | 1.3 |
| Social Emotional Learning | 3 | 1.3 |
| Transition | 3 | 1.3 |
| Assessment/Diagnostics | 2 | 0.9 |
| Bilingual Education | 2 | 0.9 |
| Mathematics | 1 | 0.4 |
| Diversity | 1 | 0.4 |
| Other (i.e., Dissemination) | 6 | 2.7 |
Note. N = 223. Job ads were coded across all specialization categories; therefore, specialization codes are not mutually exclusive.
Carnegie Classification
The majority of the job advertisements were for doctoral universities or master’s colleges and universities. Specifically, the most common Carnegie Classification was R1 universities (n = 78, 35%), followed by R2 universities (n = 38, 17%), M1 universities (n = 37, 16%), D/PU universities (n = 26, 12%), M2 universities (n = 20, 9%), and M3 universities (n = 7, 3%). The remainder of the job advertisements were for baccalaureate colleges (n = 13, 6%), special focus institutions (n = 2, 1%), associate’s colleges (n = 1, 0.4%), and baccalaureate/associate’s colleges (n = 1, 0.4%).
Position Type
In terms of position type, a total of 15 position types were listed within the job advertisements. Similar position ranks (e.g., clinical assistant professor and assistant research professor) were grouped resulting in a total of four broad position categories: assistant professor (n = 127, 57%), multiple rank (e.g., assistant/associate, associate/full; n = 65, 29%), other faculty (n = 26, 12%), and professor (n = 5, 2%). Table 2 provides the frequencies and percentages of each individual position type as well as the broad categories.
Table 2: Job Advertisement Position Type.
| POSITION TYPE | n | % |
| Assistant Professor | ||
| Assistant Professor | 110 | 49.3 |
| Clinical Assistant Professor | 10 | 4.5 |
| Assistant Teaching Professor | 3 | 1.3 |
| Assistant Research Professor | 3 | 1.3 |
| Assistant Professor of Practice | 1 | 0.4 |
| Total Assistant Professor Positions | 127 | 57.0 |
| Multiple Ranks | ||
| Assistant/Associate Professor | 41 | 18.4 |
| Open Rank | 18 | 8.1 |
| Associate/Full Professor | 6 | 2.7 |
| Total Multiple Rank Positions | 65 | 29.1 |
| Other Faculty | ||
| Faculty | 19 | 8.5 |
| Lecturer | 3 | 1.3 |
| Instructor | 2 | 0.9 |
| Clinical Instructor | 1 | 0.4 |
| Lecturer/Teaching Professor | 1 | 0.4 |
| Total Other Faculty Positions | 26 | 11.7 |
| Professor | ||
| Professor | 5 | 2.2 |
| Total Professor Positions | 5 | 2.2 |
Note. N = 223.
Location
Job advertisements were located across 44 states with New York (n = 18, 8%), California (n = 13, 6%), Indiana (n = 13, 6%), and Wisconsin (n = 11, 5%) having the largest number of job advertisements. Additionally, one job advertisement was specifically listed as remote. Figure 1 depicts the number of job advertisements by state.
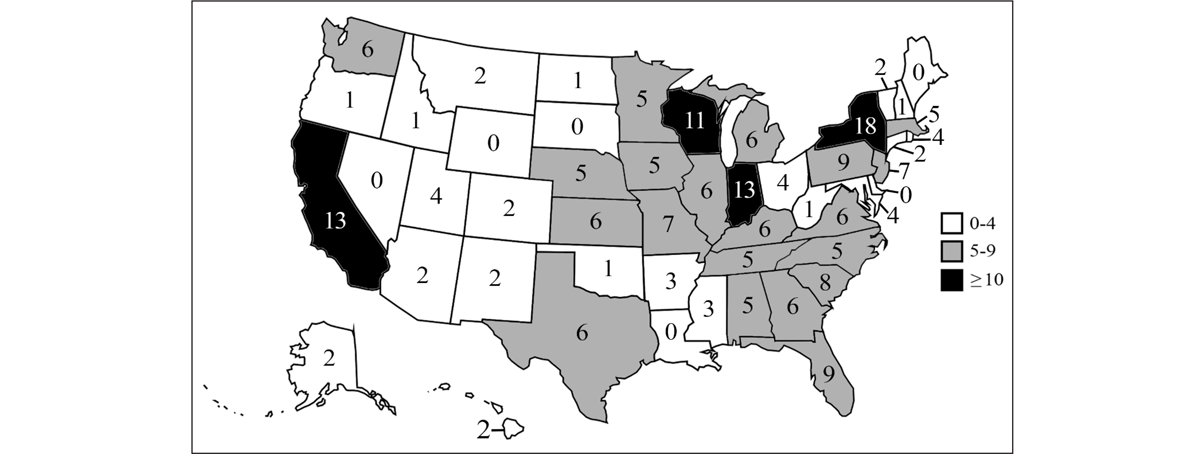
Figure 1: Number of Job Advertisements by State.
Note. A total of 222 job advertisements are represented on the map, as one job advertisement was for a remote position.
Tenure Status, Posting Date, and Application Materials
Tenure status was collected for each job advertisement and resulted in four total categories: tenure track (n = 139, 62%), non-tenure track (n = 37, 17%), not specified (n = 30, 13%), and opportunity for tenure track (n = 17, 8%). The majority of job advertisements were posted in October (n = 66, 30%), followed by September (n = 48, 22%), December (n = 25, 11%), November (n = 24, 11%), January (n = 23, 10%), and February (n = 22, 10%). The application material required most often was a teaching statement (n = 92, 41%), followed by diversity statement (n = 79, 35%), research statement (n = 58, 26%), writing sample, (n = 40, 18%), and teaching evaluations (n = 28, 13%).
Research Question 2: Relationships Among Variables
Research question 2 explored the relationships, or cross-tabulations, between the institution Carnegie Classification and other coding categories. A new Carnegie Classification variable was created to condense some Classifications. All master’s level institutions were collapsed into one category, and all baccalaureate, baccalaureate/associates, and special focus institutions were collapsed into another category. The final variable included five total Carnegie Classifications: R1, R2, D/PU, master’s level institutions, and baccalaureate/associates/special focus institutions (B/A/S). The frequencies of the five classifications were: R1 universities (n = 78, 35%), R2 (n = 38, 17%), D/PU (n = 26, 12%), master’s level (n = 64, 29%), and B/A/S (n = 17, 7%).
Specialization × Carnegie Classification
Overall specialization (i.e., only broad category of special education versus additional specialization areas of focus) was compared across job advertisements from the five categories of Carnegie Classifications. Job advertisements from master’s level institutions most commonly specified only the broad category of special education (n = 35), followed by job advertisements from R1 institutions (n = 32). Of the job advertisements that gave additional specialization areas of focus, 40% (n = 47) were from R1 institutions. When breaking down the most common specialization populations by Carnegie Classification, the most common population focus for R1 institutions was high incidence disabilities (n = 10), while low incidence disabilities were the most common population focus for R2 institutions (n = 5). Advertisements with content focused specializations were most common amongst R1 institutions and master’s level institutions. See Table 4 for all common specializations by Carnegie Classification results.
Position Type × Carnegie Classification
The majority of advertisements within each Carnegie Classification were for either assistant professor positions or multiple rank positions. The most common position type across advertisements from all five Carnegie Classifications was assistant professor, which made up between 38% and 68% of postings within each category. Job advertisements for R1 institutions had the most professor positions among the five coding categories (n = 3), while master’s institutions had the most other faculty positions (n = 11; see Table 3).
Table 3: Job Advertisement Overall Specialization, Position Type, and Tenure Status by Carnegie Classification.
| CATEGORY | CARNEGIE CLASSIFICATION (ROW %, COLUMN %) | ||||
| R1 | R2 | D/PU | MASTERS | B/A/S | |
| Overall Specialization | |||||
| Special Education | 32 (29%, 41%) | 18 (16%, 47%) | 15 (14%, 58%) | 35 (32%, 55%) | 9 (8%, 53%) |
| Additional Spec. | 47 (40%, 59%) | 20 (18%, 53%) | 11 (10%, 42%) | 29 (25%, 45%) | 8 (7%, 47%) |
| Position Type | |||||
| Assistant Professor | 39 (31%, 50%) | 26 (21%, 68%) | 10 (8%, 38%) | 42 (33%, 66%) | 10 (8%, 59%) |
| Multiple Rank | 28 (43%, 36%) | 9 (14%, 24%) | 14 (21%, 54%) | 11 (17%, 17%) | 3 (5%, 18%) |
| Professor | 3 (60%, 4%) | 1 (20%, 3%) | 0 (0%, 0%) | 0 (0%, 0%) | 1 (20%, 6%) |
| Other Faculty | 8 (31%, 10%) | 2 (8%, 5%) | 2 (8%, 8%) | 11 (42%, 17%) | 3 (11%, 17%) |
| Tenure Status | |||||
| Tenure Track | 45 (32%, 58%) | 26 (19%, 68%) | 15 (11%, 58%) | 41 (29%, 64%) | 12 (9%, 70%) |
| Tenure Opportunity | 8 (47%, 10%) | 4 (23%, 11%) | 2 (12%, 8%) | 3 (18%, 5%) | 0 (0%, 0%) |
| Non-Tenure Track | 17 (46%, 22%) | 7 (19%, 18%) | 5 (13%, 19%) | 5 (14%, 8%) | 3 (8%, 18%) |
| Not Specified | 8 (27%, 10%) | 1 (3%, 3%) | 4 (13%, 15%) | 15 (50%, 23%) | 2 (7%, 12%) |
Note. N = 223.
Common Locations × Carnegie Classification
When comparing the four most common locations (i.e., New York, California, Indiana, Wisconsin) across job advertisements from all Carnegie Classifications, advertisements from master’s institutions made up the majority of postings in New York (n = 13, 72%) and Wisconsin (n = 9, 82%). While California was the second most popular location, these job advertisements only fell across three Carnegie Classifications: R2 (n = 4, 31%), D/PU institutions (n = 3, 23%), and masters institutions (n = 6, 46%). The only location that had advertisements across all five Carnegie Classifications was Indiana, with the majority of these advertisements being from R1 (n = 4, 31%), and R2 institutions (n = 4, 31%, see Table 4).
Table 4: Common Job Advertisement Specializations, Common Locations, Common Posting Months, and Required Application Materials by Carnegie Classification.
| CATEGORY | CARNEGIE CLASSIFICATION (ROW %, COLUMN %) | ||||
| R1 | R2 | D/PU | MASTERS | B/A/S | |
| Common Populations | |||||
| High Incidence | 10 (56%, 13%) | 1 (6%, 3%) | 2 (11%, 8%) | 5 (28%, 8%) | 0 (0%, 0%) |
| Early Childhood | 3 (21%, 4%) | 3 (21%, 8%) | 1 (7%, 4%) | 5 (36%, 8%) | 2 (14%, 12%) |
| Low Incidence | 2 (22%, 3%) | 5 (56%, 13%) | 0 (0%, 0%) | 2 (22%, 3%) | 0 (0%, 0%) |
| ASD | 4 (50%, 5%) | 0 (0%, 0%) | 1 (13%, 4%) | 2 (25%, 3%) | 1 (13%, 6%) |
| SLD | 2 (28%, 3%) | 0 (0%, 0%) | 1 (14%, 4%) | 3 (43%, 5%) | 1 (14%, 6%) |
| EBD | 3 (50%, 4%) | 1 (17%, 3%) | 1 (17%, 4%) | 0 (0%, 0%) | 1 (17%, 6%) |
| Common Contents | |||||
| Reading/Literacy | 5 (33%, 6%) | 0 (0%, 0%) | 2 (13%, 8%) | 7 (47%, 11%) | 1 (7%, 6%) |
| ABA | 6 (60%, 8%) | 2 (20%, 5%) | 0 (0%, 0%) | 2 (20%, 3%) | 0 (0%, 0%) |
| Academics | 6 (75%, 8%) | 0 (0%, 0%) | 0 (0%, 0%) | 2 (25%, 3%) | 0 (0%, 0%) |
| Inclusion | 3 (38%, 4%) | 1 (13%, 3%) | 0 (0%, 0%) | 4 (50%, 6%) | 0 (0%, 0%) |
| Technology | 3 (50%, 4%) | 2 (33%, 5%) | 0 (0%, 0%) | 1 (17%, 2%) | 0 (0%, 0%) |
| Common Locations | |||||
| New York | 1 (6%, 1%) | 2 (11%, 5%) | 0 (0%, 0%) | 13 (72%, 20%) | 2 (11%, 12%) |
| California | 0 (0%, 0%) | 4 (31%, 11%) | 3 (23%, 12%) | 6 (46%, 9%) | 0 (0%, 0%) |
| Indiana | 4 (31%, 5%) | 4 (31%, 11%) | 2 (15%, 8%) | 2 (15%, 3%) | 1 (8%, 6%) |
| Wisconsin | 1 (9%, 1%) | 0 (0%, 0%) | 0 (0%, 0%) | 9 (82%, 14%) | 1 (9%, 6%) |
| Common Posting Months | |||||
| October | 22 (33%, 28%) | 18 (27%, 47%) | 7 (11%, 27%) | 15 (23%, 22%) | 4 (6%, 24%) |
| September | 21 (44%, 27%) | 7 (15%, 18%) | 4 (8%, 15%) | 14 (29%, 22%) | 2 (4%, 12%) |
| December | 8 (32%, 10%) | 3 (12%, 8%) | 2 (8%, 8%) | 10 (40%, 16%) | 2 (8%, 12%) |
| Application Materials | |||||
| Teaching Statement | 27 (30%, 35%) | 16 (17%, 42%) | 13 (14%, 50%) | 28 (30%, 44%) | 8 (8%, 47%) |
| Diversity Statement | 34 (43%, 44%) | 16 (20%, 42%) | 4 (5%, 15%) | 22 (28%, 34%) | 3 (4%, 18%) |
| Research Statement | 24 (41%, 31%) | 13 (22%, 34%) | 4 (7%, 15%) | 15 (26%, 24%) | 2 (3%, 12%) |
| Writing Sample | 28 (70%, 36%) | 7 (18%, 18%) | 2 (5%, 8%) | 1 (3%, 2%) | 2 (5%, 12%) |
| Teaching Evaluations | 9 (32%, 12%) | 3 (11%, 8%) | 3 (11%, 12%) | 10 (36%, 15%) | 3 (11%, 18%) |
Note. N = 223. ASD = Autism Spectrum Disorder, SLD = Specific Learning Disability, EBD = Emotional/Behavioral Disorder, ABA = Applied Behavior Analysis. Job ads were coded across all specialization categories; therefore, specialization codes (i.e., population and content) are not mutually exclusive.
Tenure Status × Carnegie Classification
The majority of job advertisements across all Carnegie Classifications specified the position as tenure track. Advertisements from R1 institutions were mostly specified as either tenure track (n = 45, 58%) or non-tenure track (n = 17, 22%), instead of opportunity for tenure track (n = 8, 10%). Across all Carnegie Classifications, advertisements from master’s institutions were the most common to not specify if a position was tenure track (n = 15, 23%), while job advertisements from R1 institutions were the most common to specify there was an opportunity for tenure track (n = 8, 10%).
Common Posting Month × Carnegie Classification
The most common posting month across job advertisements from all five Carnegie Classifications was October, with 47% of all advertisements for R2 institutions being posted during this month. The majority of advertisements from R1 and R2 institutions were posted during October and September, while the advertisements from D/PU, master’s level institutions, and B/A/S universities appear to be spread out most consistently across the months.
Application Materials × Carnegie Classification
Each of the five possible application materials (i.e., teaching statement, diversity statement, research statement, writing sample, and teaching evaluations) were required at least once by a job advertisement from each Carnegie Classification category. Among advertisements requiring a writing sample, 70% were from R1 institutions, while only one job advertisement from a master’s level institution made this request. Diversity statements were required most commonly from job advertisements of R1 and master’s institutions, as were teaching statements.
Additional Relationships
Additional cross-tabulations among coding categories can be found as a supplemental material attached to this manuscript and our preregistration.
Discussion
This study provides a picture of the demand for U.S. special education faculty in the 2022–2023 job market. The project was executed with outreach goals and open science practices at its core. As noted by Cook et al. (2018; 2023), research that employs open practices with intentions of transparency, accessibility, and replicability “promotes the credibility of, participation in, and use of research in all fields but may be especially important in applied fields such as special education, in which policy and practice are directly informed by research” (Cook et al., 2023, p. 238). In addition to preregistration and open materials, we used an innovative type of open data: the paired open database (POD). The POD not only provided data for analysis but also served as outreach by providing individuals on the job market a regularly updated open access spreadsheet of special education higher education job advertisements.
Findings extend the literature on the demand for U.S. special education faculty, as the most recent analysis of the demand for similar positions was over 10 years ago. The study explores the demand for special education faculty through an analysis of special education faculty advertisements identified in one academic year (i.e., 223 job advertisements for the 2022–2023 job market), as was explored years prior across several studies. Most similarly, the Sindelar and Rosenberg (2003) study of the 1997–1998 market identified 240 special education faculty job advertisements, while the study of the 1995–1996 market identified 202 assistant professor special education positions (Ryndak, 1999) and analysis of the 2010 market yielded 114 special education faculty job advertisements. When the present results are considered alongside available data on the supply of special education faculty—which indicate a decline from 2009 to 2018 in the number of special education doctoral programs and graduates (HECSE, 2023a; NCSES, 2019)—the overall story seems to suggest that a supply/demand imbalance of special education faculty may still be present in the United States and warrants further research.
Another interesting similarity between the present and previous studies is the tendency for some IHEs to “cast a wide net” by either (a) not emphasizing specific areas of focus in a faculty advertisement and instead advertising broadly for “special education” or (b) including several specific areas of focus within one advertisement (Ryndak et al., 1999). Montrosse and Young (2012) identified 33% of 114 total positions advertised broadly for “general special education.” We found that nearly half of the advertisements in the present study (i.e., 109 job advertisements of 223 total) were for “special education” without any mention of specific areas of focus, and eight advertisements listed many possible areas of focus. There are several possible reasons for crafting a job advertisement that may elicit applications from many candidates with varied areas of expertise, and these reasons could be impacted by the needs, interests, funds, and/or resources of the department or IHE. However, it is important to note that when researchers over 20 years ago found special education faculty advertisements were often seeking candidates across multiple areas of expertise, they conjectured that it was in response to the U.S. shortage of special education faculty (Ryndak et al., 1999).
While our findings may suggest there is still a demand for special education faculty and share similarities to findings of other studies across the last 22 years (e.g., Montrosse & Young, 2012; Smith et al., 2011), there were also notable differences among the data collected. In contrast to previous studies, our study found more variety in specializations, with the most common specialization being high incidence disabilities as opposed to the narrower category of learning disabilities (Ryndak et al., 1999). The finding of a broad specialization area (i.e., high incidence disabilities) being the most common specialization in the present study again suggests a tendency for some IHEs to advertise broadly. After expertise in high incidence disabilities, the next commonly sought-after specialization areas were reading/literacy, early childhood education, ABA, and low incidence disabilities. The variation in specialization may also be influenced by changes in special education licensure over the past 20 years, impacting the specialization requested within faculty job advertisements. Many states have shifted from specific disability category licensure (e.g., learning disabilities) to more generalist licensure (e.g., no distinct disability category; Sindelar et al., 2019). Another aspect that differed between the current study and prior studies is the inclusion of additional coding categories. For example, the current study provides a breakdown of positions according to tenure status (e.g., tenure track versus non-tenure track) that was not reported in the prior literature; while this difference limits the ability to make comparisons between, for example, the prevalence of tenure-track positions in the prior academic job market years to the 2022–2023 job market, we hope that future years of data collected in the POD will allow for longitudinal investigations exploring potential changes over time in the demand for tenure-track special education positions in particular.
The identification of 223 total job advertisements in the 2022–2023 job market suggests a variety of opportunities for those seeking a special education faculty position as our analysis found 38 specializations, 13 position types, and 44 states represented across all job advertisements. Aligned with our research question 1 hypotheses, the most common position type was assistant professor, and the most common tenure status was tenure track positions. Yet advertisements differed among coding categories, meaning there may not be an abundance of job advertisements that meet an individual’s preferences which may lead an individual to experience a competitive job market.
The research question 2 findings, focused on relationships between Carnegie Classification and other coding categories, point to potential situations that could lead to a competitive market. For example, we identified a total of 45 total job advertisements at R1 institutions that were tenure track. A scholar seeking a faculty position at an R1 institution—whose search is narrowed even more because they limit their search to certain states and are trained in one particular area of focus within special education—may have encountered a limited pool of potential options in the 2022–2023 job market. Their list of potential job opportunities could also be constrained by the specific specializations emphasized in advertisements. For example, a candidate without training in ABA will likely not apply for a position that specifically seeks ABA expertise, and in the 2022–2023 job market cycle, this choice would eliminate six potential job postings at R1 institutions. To further illustrate, a candidate searching for a position with the specialization of high incidence disabilities at an R1 institution during the 2022–2023 job market would have only eight possible positions out of the 223 total that fit their criteria; if this candidate hoped to find a position in the northeast, the number of possible positions would reduce to only one. That is, our findings point to possible reasons scholars seeking a new special education faculty position may experience a competitive job market with a limited pool of potential options.
Implications
This study has implications for multiple stakeholders. Most immediately, doctoral students and other scholars preparing for the academic job market can use these findings to inform decisions and plans leading up to applying for faculty positions. As candidates may strive to obtain jobs based on the Carnegie Classification of an institution, these data can guide job search efforts. For example, the doctoral student described above who aspires to obtain a position at an R1 institution can seek opportunities during their doctoral training focused on writing and manuscript preparation, as scholarly writing samples are a common requirement for R1 institutions. Moreover, the knowledge of when special education faculty job advertisements are commonly posted can inform scholars’ time management, as applying to faculty positions is a time-consuming effort (Fernandes et al., 2020).
Implications for job search committee chairs also emerged throughout data collection. While our study employed robust searches, it became apparent some job advertisements meeting inclusion criteria were not identified through our searches (i.e., three job advertisements sent as personal communications were not identified during data collection). One recommendation is to include “special education” in the job advertisement title when posting on websites such as The Chronicle of Higher Education and Inside Higher Education Jobs, as “special education” is likely a common search term used by candidates when searching for special education faculty advertisements. Of the 223 total job advertisements found in this study, 178 contained “special education” in the title, while the remaining 45 had titles containing only position type (e.g., assistant professor), a specific disability category (e.g., visual impairment), or terms associated with special education (e.g., inclusive education, education studies). Important to note is that some states use different terminology when referring to special education (e.g., exceptional student education in Florida). While these job advertisements were identified through data collection procedures using the search term “special education,” many advertisements required further investigation by reading the full advertisement to determine the position was in the area of special education. It is possible a scholar sifting through numerous advertisements across multiple job advertisement websites could overlook a potential job advertisement if the title does not include “special education.” Therefore, a second recommendation is to use the relevant tags available on the websites when posting an advertisement, such as selecting the tags “special education” and “full-time.” It is possible job advertisements without “special education” in the title or relevant tags could be missed by scholars on the job market.
Findings from this study may have implications for special education doctoral programs and higher education faculty teaching future and in-service special education leaders. As it is the responsibility of doctoral programs to prepare their students for the job market, programs may choose to look at the alignment of specialization areas offered within their program to those that are currently in demand on the job market. Misalignment may suggest the need for new specializations to be added to doctoral programs, so that course offerings and the training students receive prepare them well for the demands of the current job market. Finally, this study may hold implications for OSEP and other federal funding agencies because findings could inform competitions specific to funding special education doctoral candidates within IHEs. However, when considering implications of the present study, it is important to keep in mind the study’s limitations and its focus on one specific year of the special education faculty job market.
Limitations and Future Directions
Several limitations associated with this study should be noted. First, our analysis only included job advertisements found across four websites. While these websites have been used in similar studies and provide robust results, there are limitations to using them exclusively. First, advertising on these websites is costly for institutions, and consequently, our searches did not capture job advertisements from institutions that chose not to pay to advertise on these websites. Additionally, our study sought to find job advertisements that began in Fall 2023; data collection procedures may not have captured positions that did not provide a start date. Furthermore, while this study employed systematic data collection procedures, it is important to note the job advertisement websites differ from databases built for research purposes (e.g., unable to effectively search within start and end dates, remove duplicates, or export results). As such, it was not feasible to report certain information (e.g., total job advertisements yielded through website searches and screened) traditionally found in systematic reviews of the literature.
While this study provides an updated overview of the demand for special education faculty, it does not offer insights on the supply of new doctorates available to fill special education positions. Future research should seek to investigate special education faculty advertisements—categorized by faculty position subcategories (e.g., positions only available to early career scholars)—along with sources of data on the supply of new special education doctorates (e.g., Survey of Earned Doctorates; NCSES, 2019). The time may be now for a replication of the prior OSEP-funded projects from 1999 and 2007; these large projects had the capacity to provide a broad picture of special education faculty supply and demand by investigating and triangulating several sources of data including faculty advertisements, reasons for failed searches, characteristics of doctoral programs, and career paths of special education doctoral graduates. Future work could analyze supply/demand along with faculty preparation, faculty recruitment, and faculty retention practices; one example is to explore how the current demand for special education faculty may support or deter efforts to recruit and retain a diverse special education workforce. Finally, this study provides one snapshot of the demand for U.S. special education faculty; additional years of data should be analyzed to better understand the trends present across multiple job market cycles.
We also urge the field to consider future directions and possibilities for paired open data. The use of the POD in the present study amplified our work; the POD allowed us to share data in real time (i.e., via weekly updates reflecting our weekly job advertisement searches across the data collection timeframe) that served outreach goals. This purpose centered on outreach motivated the current study and also informs the larger project and our future directions. The connections formed between our research team and the special education academic community via the POD (e.g., through outreach and social media dissemination activities, scholars reaching out to us to share job advertisements, scholars emailing thank-you notes for providing the database that helped them with their job search) suggest broader impacts of leveraging paired open data. We thus highly recommend that the research community not only use open science practices, but also consider other beneficial uses of and possibilities for paired open data in particular.
Conclusion
This study provides an analysis of the Special Education Faculty Jobs POD containing faculty advertisements for the 2022–2023 job market. The available findings, in tandem with existing data on the supply of special education faculty, raises critical questions about whether a shortage of special education faculty continues to persist in the United States. Special education faculty members “are the primary source of new research involving effective interventions for students with disabilities” and “the primary preparers of future teachers” (Smith et al., 2011, p. 11). Overall, considering that “the field of special education—more importantly, the outcomes of students with disabilities—is so heavily dependent on [special education] faculty” (Smith et al., 2011, p. 11), additional research is warranted to further investigate the current supply and demand of special education faculty.
Competing Interests
The authors have no competing interests to declare.
Author Contribution
Lindsey G. Mirielli: Conceptualization, Formal Analysis, Investigation, Methodology, Project Administration, Resources, Writing – Original Draft, Writing – Review & Editing; Jessica Rodrigues: Conceptualization, Methodology, Supervision, Visualization, Writing – Original Draft, Writing – Review & Editing; Emily L. Singell: Investigation, Resources, Writing - Review & Editing.
References
Academic Keys. (n.d.). Find a job. https://www.academickeys.com/all/choose_discipline.php?go=find_a_job
Chronicle of Higher Education. (n.d.). Jobs. https://jobs.chronicle.com/jobs/
Cook, B. G., & Cook, S. C. (2013). Unraveling evidence-based practices in special education. The Journal of Special Education, 47(2), 71–82. http://doi.org/10.1177/0022466911420877
Cook, B. G., Lloyd, J. W., Mellor, D., Nosek, B. A., & Therrien, W. J. (2018). Promoting open science to increase the trustworthiness of evidence in special education. Exceptional Children, 85(1), 104–118. http://doi.org/10.1177/0014402918793138
Cook, B. G., van Dijk, W., Vargas, I., Aigotti, S. M., Fleming, J. I., McDonald, S. D., Richmond, C. L., Griendling, L. M., McLucas, A. S., & Johnson, R. M. (2023). A targeted review of open practices in special education publications. Exceptional Children, 89(3), 238–255. http://doi.org/10.1177/00144029221145195
deBettencourt, L. U., Hoover, J. J., Rude, H. A., & Taylor, S. S. (2016). Preparing special education higher education faculty: The influences of contemporary education issues and policy recommendations. Teacher Education and Special Education, 39(2), 121–133. http://doi.org/10.1177/0888406416641007
Division for Research – CEC. (2020, October 3). What is the Job Search Process? [Video]. YouTube. https://www.youtube.com/watch?v=BIfF-HftQdA&t=12s
Fernandes, J. D., Sarabipour, S., Smith, C. T., Niemi, N. M., Jadavji, N. M., Kozik, A. J., Holehouse, A. S., Pejaver, V., Symmons, O., Bisson Filho, A. W., & Haage, A. (2020). A survey-based analysis of the academic job market. Elife, 9. http://doi.org/10.7554/eLife.54097
Higher Education Consortium for Special Education (HECSE). (2023a). The Shortage of Special Education Teachers and Higher Education Faculty. [Fact Sheet]. https://hecse.net/resources/winter-summit-materials/
Higher Education Consortium for Special Education (HECSE). (2023b). 2023 Legislative Priorities. https://hecse.net/resources/winter-summit-materials/
HigherEdJobs. (n.d.). HigherEdJobs. https://www.higheredjobs.com/?locale=en_US
Hsu, N. S., Rezai-Zadeh, K. P., Tennekoon, M. S., & Korn, S. J. (2021). Myths and facts about getting an academic faculty position in neuroscience. Science Advances, 7(35). http://doi.org/10.1126/sciadv.abj2604
Inside Higher Ed. (n.d.). Inside Higher Ed career center. https://careers.insidehighered.com/
Lubisco, R., Birren, G. F., & Vooris, R. (2019). Examining job postings in sport management academia. Sport Management Education Journal, 13(2), 92–99. http://doi.org/10.1123/smej.2018-0029
McDowell, G. S., Gunsalus, K. T., MacKellar, D. C., Mazzilli, S. A., Pai, V. P., Goodwin, P. R., Walsh, E. M., Robinson-Mosher, A., Bowman, T. A., Kraemer, J., Erb, M. L., Schoenfeld, E., Shokri, L., Jackson, J. D., Islam, A., Mattozzi, M. D., Krukenberg, K. A., & Polka, J. K. (2014). Shaping the future of research: A perspective from junior scientists. F1000Research, 3(291), 291. http://doi.org/10.12688/f1000research.5878.1
Montrosse, B. E., & Young, C. J. (2012). Market demand for special education faculty. Teacher Education and Special Education, 35(2), 140–153. http://doi.org/10.1177/0888406412444763
National Center for Science and Engineering Statistics (NCSES), National Science Foundation. (2019). Doctorate Recipients from U.S. Universities: 2019. NSF 21-308. Alexandria, VA. https://ncses.nsf.gov/pubs/nsf21308/
Rodrigues, J., & Mirielli, L. (2022). An overview of the 2021–2022 special education faculty job market. Council for Exceptional Children Division for Research (CEC-DR) Newsletter, 35(3), 2–4.
Ryndak, D. L., Morrison, A. P., & Sommerstein, L. (1999). Literacy before and after inclusion in general education settings: A case study. Journal of the Association for Persons with Severe Handicaps, 24(1), 5–22. http://doi.org/10.2511/rpsd.24.1.5
Schles, R. A., & Robertson, R. E. (2019). The role of performance feedback and implementation of evidence-based practices for preservice special education teachers and student outcomes: A review of the literature. Teacher Education and Special Education, 42(1), 36–48. http://doi.org/10.1177/0888406417736571
Sindelar, P. T., Buck, G. H., Carpenter, S., & Watanabe, A. K. (1993). Supply and demand of leadership personnel in special education: A follow-up study with analysis of failed searches. Teacher Education and Special Education, 16(3), 240–247. http://doi.org/10.1177/088840649301600306
Sindelar, P. T., & Rosenberg, M. S. (2003). The demand for faculty in special education: A study of searches conducted in 1997–98. Teacher Education and Special Education, 26(3), 165–171. http://doi.org/10.1177/088840640302600303
Sindelar, P. T., & Taylor, C. (1988). Supply and demand for doctoral personnel in special education and communication disorders. Teacher Education and Special Education, 11(4), 162–167. http://doi.org/10.1177/088840648801100404
Smith, D. D. (2012). Welcome to the TESE special issue about the special education faculty needs assessment project. Teacher Education and Special Education, 35(2), 97–100. http://doi.org/10.1177/0888406412444761
Smith, D. D., Montrosse, B. E., Robb, S. M., Tyler, N. C., & Young, C. (2011). Assessing trends in leadership: Special education’s capacity to produce a highly qualified workforce. Claremont, CA: IRIS@CGU, Claremont Graduate University.
The Carnegie Classification of Institutions of Higher Education (CCIHE). (n.d.). Institute Search. https://carnegieclassifications.acenet.edu/
West, J. E., & Hardman, M. L. (2012). Averting current and future special education faculty shortages: Policy implications and recommendations. Teacher Education and Special Education, 35(2), 154–160. http://doi.org/10.1177/0888406412444456